Spending guardrails, measured against your whole plan
Last updated: August 30, 2026
A fixed retirement spending figure has to be sized for the worst markets, because it never bends. Guardrails are the alternative: agree in advance to small, rule-bound adjustments — trim a little in bad stretches, raise a little in good ones — and the same plan can support a meaningfully better spending level, because flexibility absorbs what padding otherwise must. This page explains the guardrails ZBee implements, the one deliberate change it makes to how they are measured, and the evidence and limits behind that change. It is the deep companion to the methodology page, which covers the whole model.
The published rules, in plain terms
ZBee's guardrails are the decision rules published by Jonathan Guyton and William Klinger in the Journal of Financial Planning (2004, 2006) — the most widely implemented dynamic-spending method in retirement planning, and the one most advisors mean when they say "guardrails." Your first retirement year sets an anchor. Each year after, the plan re-tests spending against that anchor:
- Capital preservation — if the measured rate drifts more than 20% above the anchor, spending is trimmed 10%.
- Prosperity — if it falls more than 20% below, spending is raised 10%.
- The withdrawal rule — after a negative-return year with the rate above the anchor, that year's inflation increase is skipped. Permanently: there is no later make-up.
- The late-plan suspension — the trim rule stands down in the final 15 years of the horizon, because drawing down toward your bequest late in the plan is the plan working, not a market emergency.
In ZBee the adjustments touch only non-essential spending: the essential budget you declare is a floor the rules never cut into. And the plan doesn't just simulate the policy — it shows you this year's actual trigger points in dollars, so the rule the simulation assumed is one you can follow, and check, by hand.
The blind spot in the published test
The published method tests one number: this year's spending as a share of the portfolio balance. That single state variable is the method's weakness, because the portfolio is not your whole plan:
- Bridge years read as emergencies. Retire at 65 and claim Social Security at 70, and the lean bridge years are indistinguishable — to a portfolio-only test — from permanent depletion. The rules trim as though the tight stretch were the whole retirement, even though a large guaranteed paycheck is scheduled and certain.
- Windfalls read as bull markets. A known inheritance or home sale landing mid-plan spikes the balance, mechanically triggers the raise rule, and disarms the trim rule — at exactly the wrong moments.
- Normal aging reads as danger. The portfolio is supposed to shrink across retirement. A ratio measured against a deliberately shrinking base drifts upward even when everything is on plan — so trims accumulate, and the opening figure gets quietly walked back over the years.
None of these are market events. They are facts the plan knew on day one, invisible to a test that can only see the portfolio.
What ZBee measures instead
ZBee keeps the Guyton-Klinger rules and changes only the measuring stick. Spending is tested against the plan's sustainable payout — the steady paycheck the whole plan could afford — computed from economic wealth:
- the portfolio,
- plus the present value of guaranteed income still to come (Social Security, pensions),
- plus the present value of scheduled one-time cashflows,
- less the present value of the bequest you've earmarked.
Divide that by an annuity factor over the years remaining and you get the sustainable payout; the guardrail rate is simply this year's spending as a share of it. A plan that is on track measures near its anchor, whatever the calendar says. The bridge year before Social Security no longer reads as trouble, the known inheritance no longer reads as a bull market, and — because the payout is normalized over the remaining horizon — the ratio stops drifting upward just because a year has passed. The rate moves when markets move.
The present values and the annuity factor use a 2% real discount rate — deliberately lower than the plan's own assumed return, because crediting the portfolio with its expected return inside the very rule that decides whether to cut after a downturn would understate sequence-of-returns risk. The rate is deliberately not load-bearing: the simulation still sets the spending level and the published rules still set the step sizes, so the discount rate only has to make one year comparable to the next. Across 1–4% it moves the headline figure but barely the lived outcome.
The measure itself is not a ZBee invention — testing spending against annuitized economic wealth is a long-established idea, and several published methods use the recalculated payout as the spending rule itself, so spending tracks the market up and down every year. ZBee deliberately does not: the payout is only the measuring stick, and spending still moves in Guyton-Klinger's own 10% steps inside ±20% bands — a normal market year changes nothing at all. What's particular here is the pairing, not the measure.
What it does to the number you can hold
One consequence runs against intuition, and we'd rather you hear it from us: on the same plan, this model usually produces a lower opening figure than the published rule does. That is the mechanism working. The published rule's upward-drifting ratio lets it start higher — and then walk the figure back with accumulating trims. In our testing across eleven plan shapes, lifetime spending under the published rule settled below its own opening figure on ten of them, averaging about 80% of it; under this model it settled at or above the opening figure on nine. Those are simulations of particular plans, not a promise about yours — but the direction follows from the mechanism, not the sample. A smaller number you can actually hold is worth more than a larger one that gets reduced later.
There is a second consequence, and it is the point of the whole exercise: on those same plans, holding a figure you can keep also left far fewer of them ever short. Across the plans with real deferred income — Social Security still to come, or a large expense to brace for — the share of simulations that ran short at any point fell from roughly one in six to between one and six in a hundred, and the worst-case lifetime shortfall fell to nothing. Spending a little more of what is yours and running less risk of a shortfall are not usually the same direction; here they are, because the model stops hoarding savings against income you are already owed. As above, these are particular simulated plans, not a promise about yours.
Why not "risk-based" guardrails?
The other modern answer to the portfolio-only blind spot is risk-based guardrails: re-solve the plan's success probability every year and key adjustments off that. It is a rigorous approach — and it is the reason the critique "portfolio-percentage rules ignore future cash flows" is correct about the published formulation. But it is not correct about ZBee's: counting future cash flows is precisely what the sustainable-payout denominator does. ZBee gets the income-awareness without the machinery risk-based methods require — nested simulation or a fitted policy function — and without the deeper problem that machinery brings: running one policy inside the simulation while displaying another would put two contradicting answers on the same screen. The tools that implement risk-based guardrails at full rigor are built for advisors and sold at advisor-platform prices; ZBee's aim is the same income-aware discipline, measured transparently, on your own Mac.
One honest consequence of income-awareness, either way: where guaranteed income alone covers the planned spending, no portfolio level can trigger a trim — and the app reports that state plainly rather than inventing a threshold.
The honest limits
- Economic wealth is measured pre-tax, while the spending under test is what survives the tax engine — a disclosed simplification rather than a second tax model inside the rule.
- The horizon is fixed, not mortality-weighted. The annuity factor runs to your planned end age with certainty, where true annuitization would weight each year by the chance of reaching it.
- Guaranteed income is discounted at one flat real rate, as if riskless — a deliberate simplification the 1–4% robustness check exists to bound.
- Scheduled amounts are trusted as entered. An uncertain inheritance belongs in the plan at a haircut, or not at all.
Watching it work
Nothing above needs to be taken on faith. With guardrails on, the Projection page shows this year's trigger points in dollars — the level below which spending trims (and to what), and the level above which a raise is earned. The year-by-year table goes further: click any row and ZBee shows that year's full arithmetic, including what the guardrails did and the exact rate the year was tested at. And the Trade-offs page will measure your plan with guardrails on and off, side by side, so the value of flexing is a number rather than a slogan.
ZBee walks it with you
Guardrails only earn their keep if they're applied over the years, not admired once. With ZBee Pro keeping your positions current, the corridor stays this year's two dollar figures on the Projection page; a macOS notification tells you when a refresh finds markets have crossed one of your rails; and the Performance page keeps the record — the level the rails actually guided you to, drawn day by day beside the freshly solved figure, every trim and raise marked.
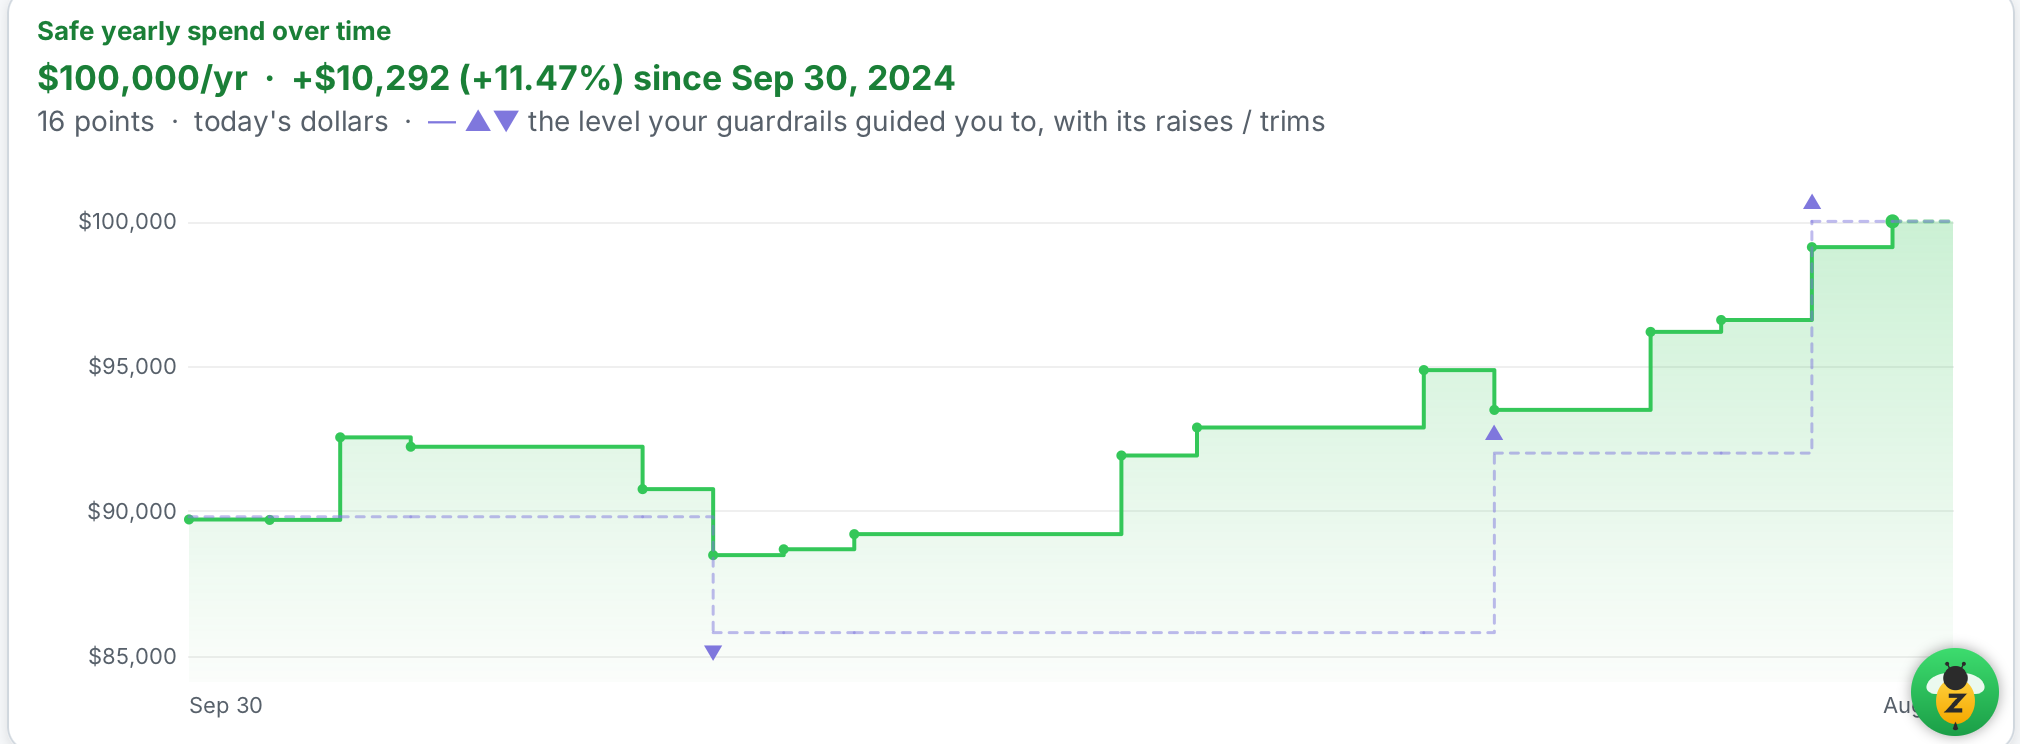
That's the arrangement in one sentence: the rails guide, and ZBee measures them and keeps the record — your own adjustments, walked backward through your own history.
Related: the full methodology (taxes, RMDs, Social Security, market risk, longevity) · how much can you safely spend in retirement? · how ZBee compares to other tools, including Boldin's guardrails, FIRECalc and cFIREsim.