Inside the number: how ZBee™ reads 1,000 simulated markets
Last updated: October 6, 2026
ZBee answers one question: what is the most you can spend each year, from what you hold today, and still reach the end of your plan with your bequest intact? It does not predict the market. Instead it runs your plan through 1,000 different possible futures and reports what holds up across them. Everything on the Projection page is a different view of that same set of 1,000 futures. This page walks through what happens between pressing Calculate and the figures on screen: where the simulated markets come from, how the safe yearly spend is found, and which of those markets each chart and table is showing you. The methodology covers the tax, Social Security, Medicare and longevity methods inside each year; this page is about how the years add up.
The 1,000 simulated markets
A simulated market is one possible sequence of yearly investment returns running from today to the end age in your plan. ZBee generates 1,000 of them from a fixed starting point, so the same 1,000 sequences come back every time you calculate. That matters more than it sounds. Because every chart is built from the same markets, the pieces always agree with each other, and a change in your number is a change in your plan, never random noise from a fresh set of draws.
You choose how the sequences are generated: a bell-curve model that draws each year's return independently, or a historical model that resamples real market history in multi-year blocks so crashes cluster and recoveries follow. The methodology's market-risk section explains both and why they can give slightly different numbers. Everything on this page holds for either one.
Each market is run year by year with the full plan in play: withdrawals by tax type, federal and state tax, required minimum distributions, Social Security at the claim age you chose, any pension or other income, one-time events, Medicare surcharges where they apply, and the guardrails if they are on. The result of one run is a year-by-year table ending with a final balance.
Step one: finding the safe yearly spend
The calculation starts by searching for your number. It picks a trial spending level, runs all 1,000 markets at that level, and counts how many reach the end age with the bequest still there. If enough of them do, it tries a higher figure. If too few do, it tries a lower one. It keeps narrowing until it lands on the highest yearly spend that lasts in the share of markets your risk setting asks for.
- Conservative asks for 90 markets in 100 to last.
- Balanced asks for 75 in 100.
- Aggressive asks for 50 in 100.
That highest figure is the large number at the top of the Projection page, your safe yearly spend. Everything that follows is run at that spending level.
Step two: seven passes over the same markets
Once the number is known, ZBee makes several more passes through the same 1,000 markets to fill in the rest of the page. The diagram below shows them. Two of the passes pick out a single market to show you in detail. The others keep all 1,000 and summarise them.
Reading the diagram from the top:
- Find the safe yearly spend. The search described above. The figure it lands on is the number at the top of the page.
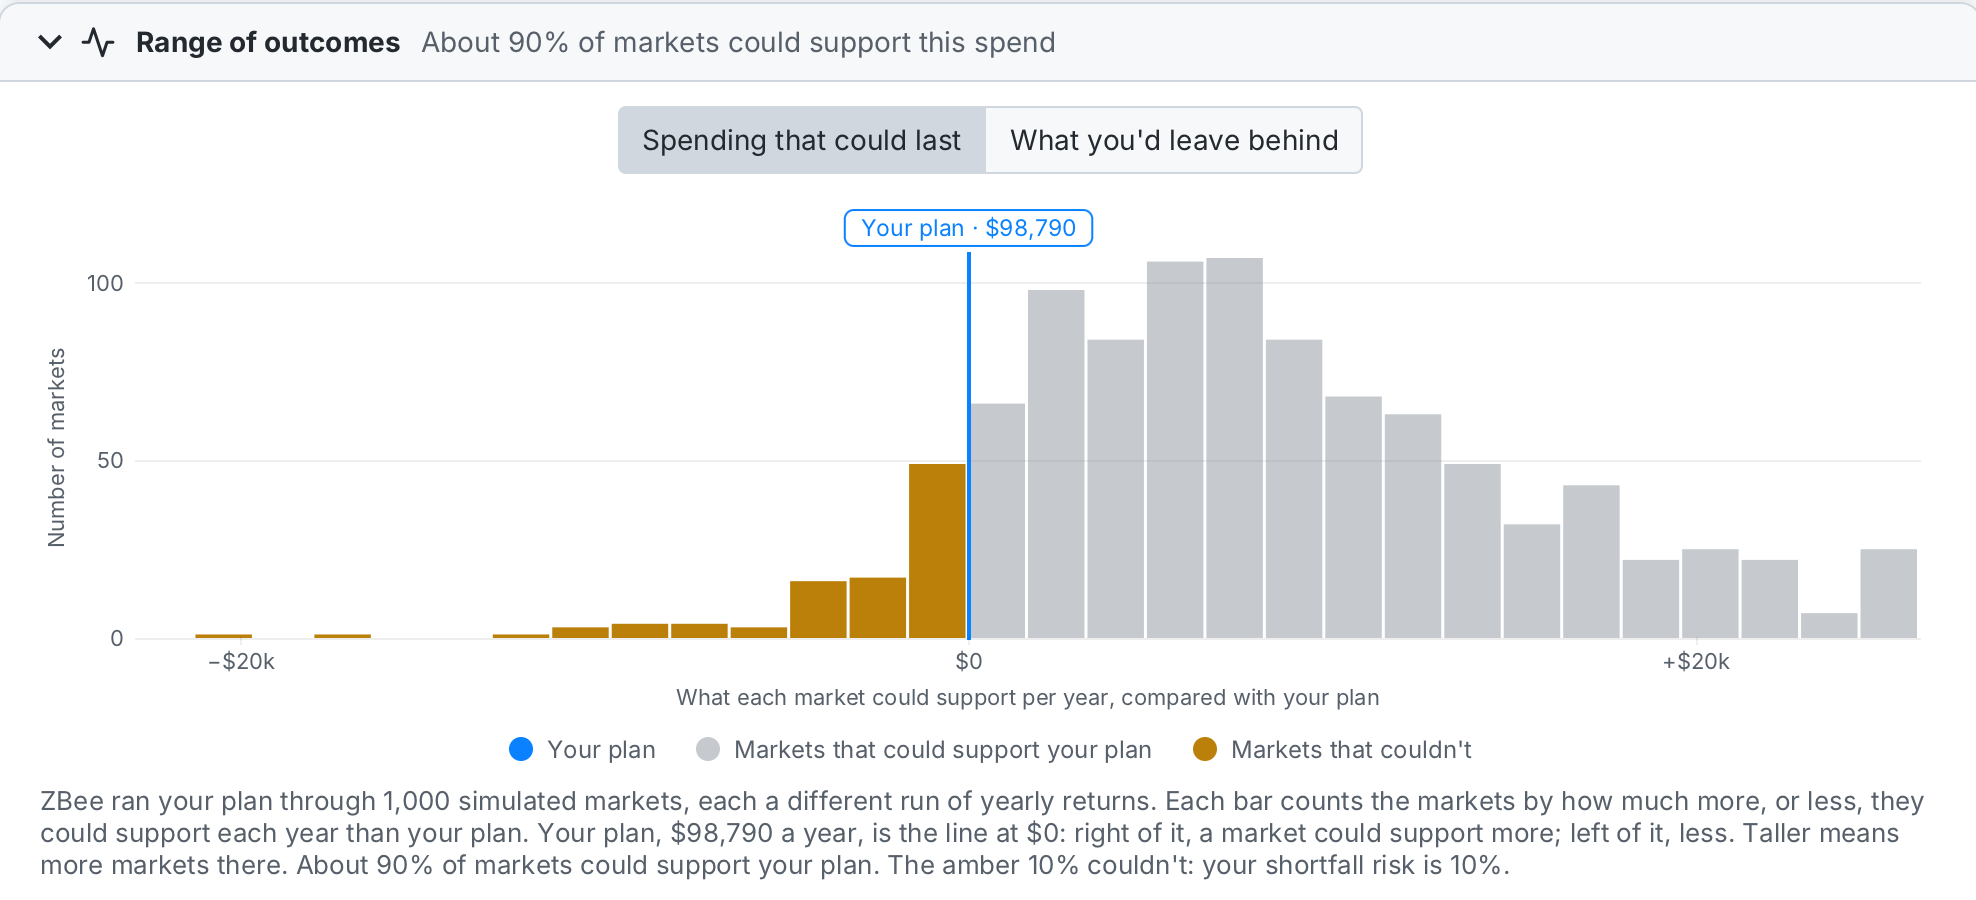
- Checks on the number. At that spending level, the share of markets that actually last, the range of yearly spending the guardrails would deliver across the markets (shown as the Strategy row's band), and a separate replay against every complete stretch of real market history since 1928. These sit on the top card beside the number.
- Tough. One market, chosen as described in the next section.
- Typical. One market, also described below.
- Spreads. Two histograms for the Range of outcomes pane. "Spending that could last" asks each of the 1,000 markets what its own highest lasting spend would have been, and plots how much more or less than your number each one is. Your number is the line at $0. With the Conservative setting 90 in 100 markets land at or to the right of it, because that is how it was found; the amber ones to its left are the markets that couldn't support it. "What you'd leave behind" runs every market at your number and plots the 1,000 final balances.
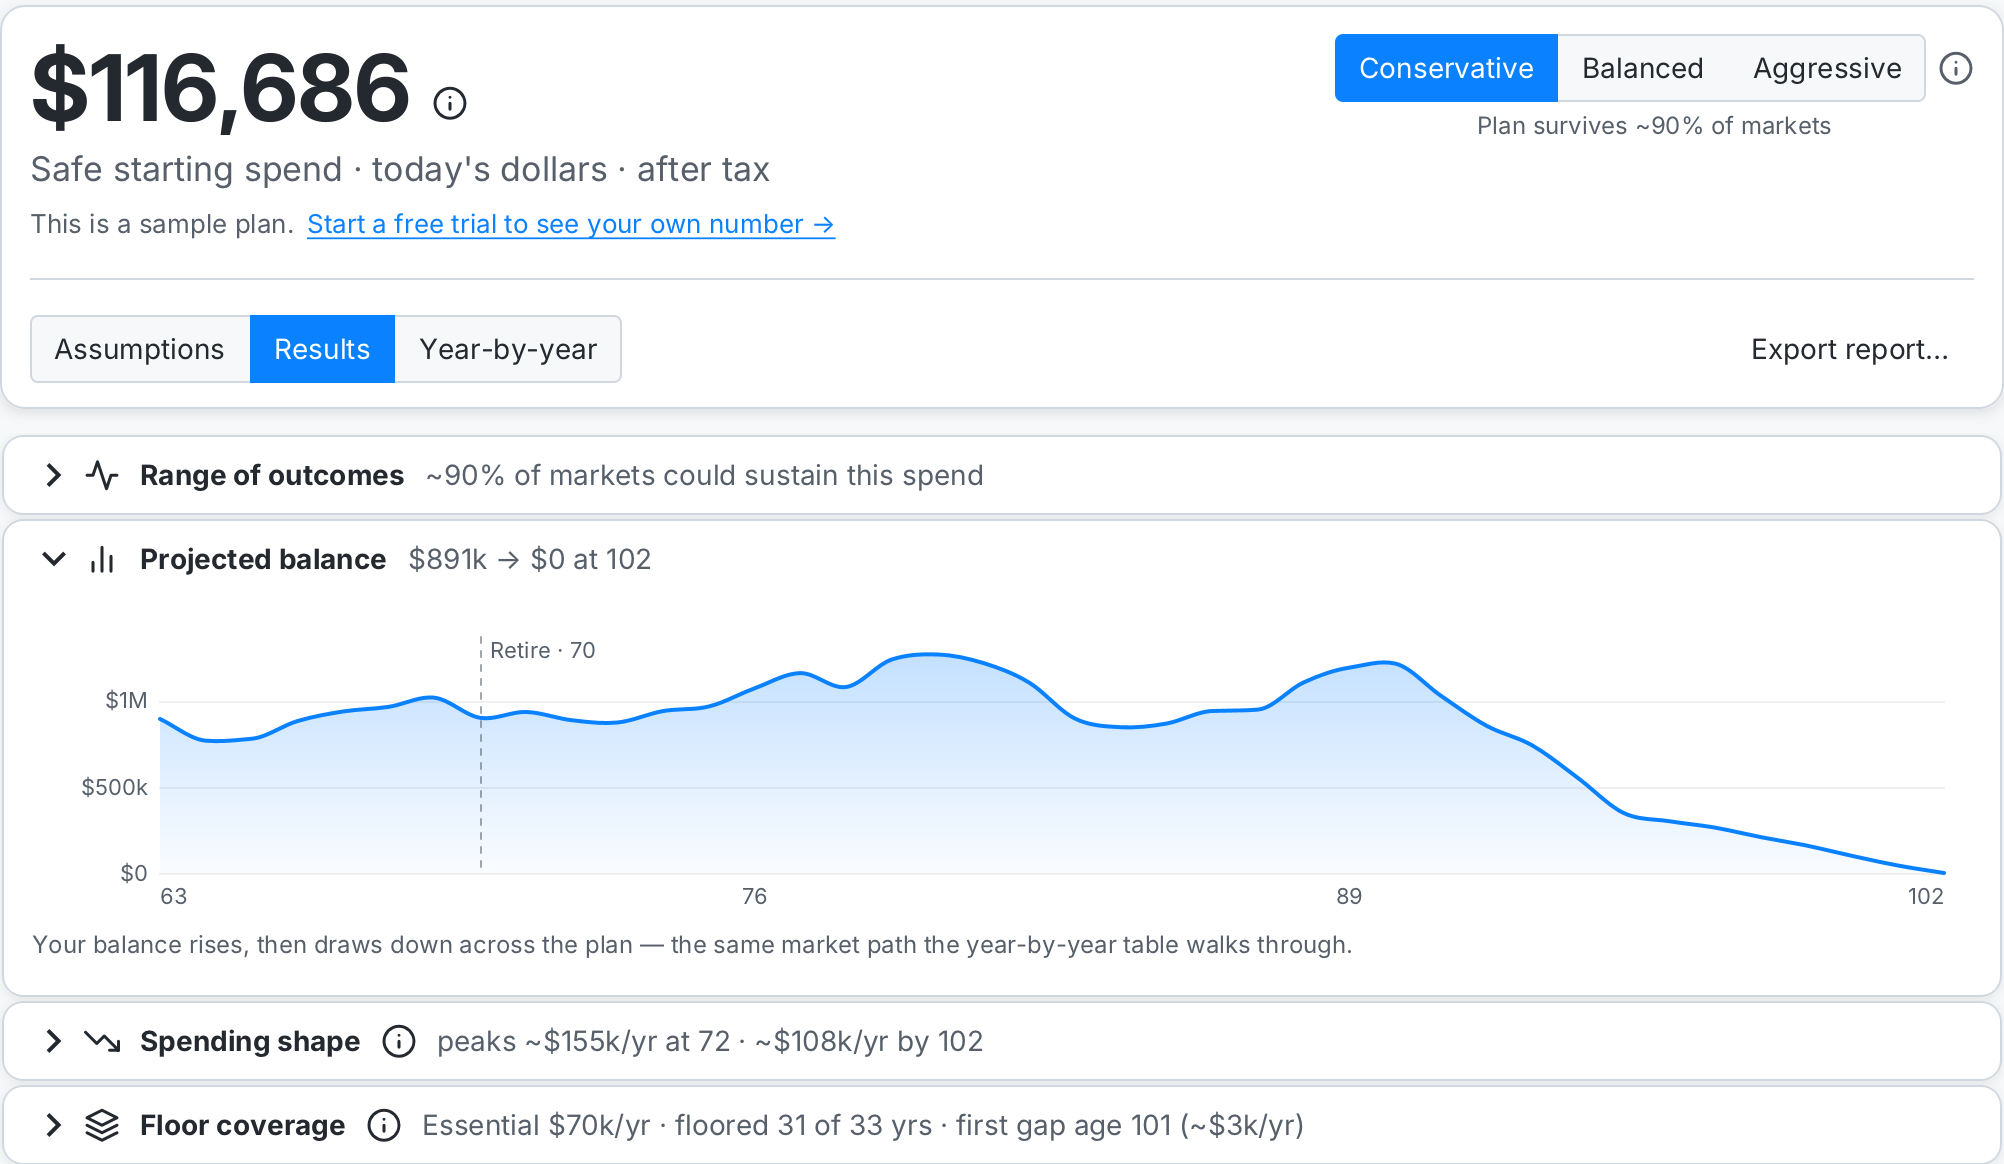
- Fan band. For every age, the 10th, 25th, 75th and 90th percentile balance across the 1,000 markets. This is the shading on the Projected balance chart.
The number appears on screen as soon as the first two passes finish. The charts fill in a moment later as the remaining passes complete.
Two markets you can look at year by year
A spread of 1,000 outcomes is honest but hard to read. So ZBee also picks two individual markets out of the thousand and lets you walk through either one year by year in the table. They are real sequences from the set, not averages and not invented paths.
Tough is the market your number is built to last through. All 1,000 markets are ranked by their final balance at your spending level. With the Conservative setting, the boundary is roughly the 100th-worst market of the 1,000, the point where 90 in 100 do better. ZBee looks at the markets that end at or just above that boundary and picks the one whose balance stays nearest the 10th-percentile balance in every year, not just the last. So it is tough all the way through, rather than a market that booms for a decade and then busts. If some of those markets ran short of money along the way, it picks one that didn't. Its final balance lands close to your bequest target by construction. When the table shows this market ending near the target, or near zero if you set no bequest, that is the plan spending everything it safely can, not the plan failing. This is the table's default, because it is the view that justifies the number.
Typical is the market closest to the middle of the pack, and it is the likelier lived experience. ZBee first works out the median balance for every year across all 1,000 markets. It then looks at the markets whose final balances fall in the middle tenth of the ranking and picks the one that stays nearest that median line in every year, not just the last. This usually ends with a surplus above the bequest.
Why not simply take the market at the exact rank? Because a final balance says nothing about the road there. Dozens of very different markets finish within a few dollars of each other at any rank: one might glide down steadily, another might boom early and crash late. Taking whichever lands on the rank could show a tough market sitting above the typical one for years, and a small change to your plan could swap in a market with a quite different shape. Choosing the market that stays near its percentile all the way through keeps the picture honest and the figures steady.
With the Aggressive setting, the required share is 50 in 100, so the tough market and the typical market are the same place in the ranking. The table says so rather than offering two names for one market, and the balance chart draws a single line.
Step three: which market each pane shows
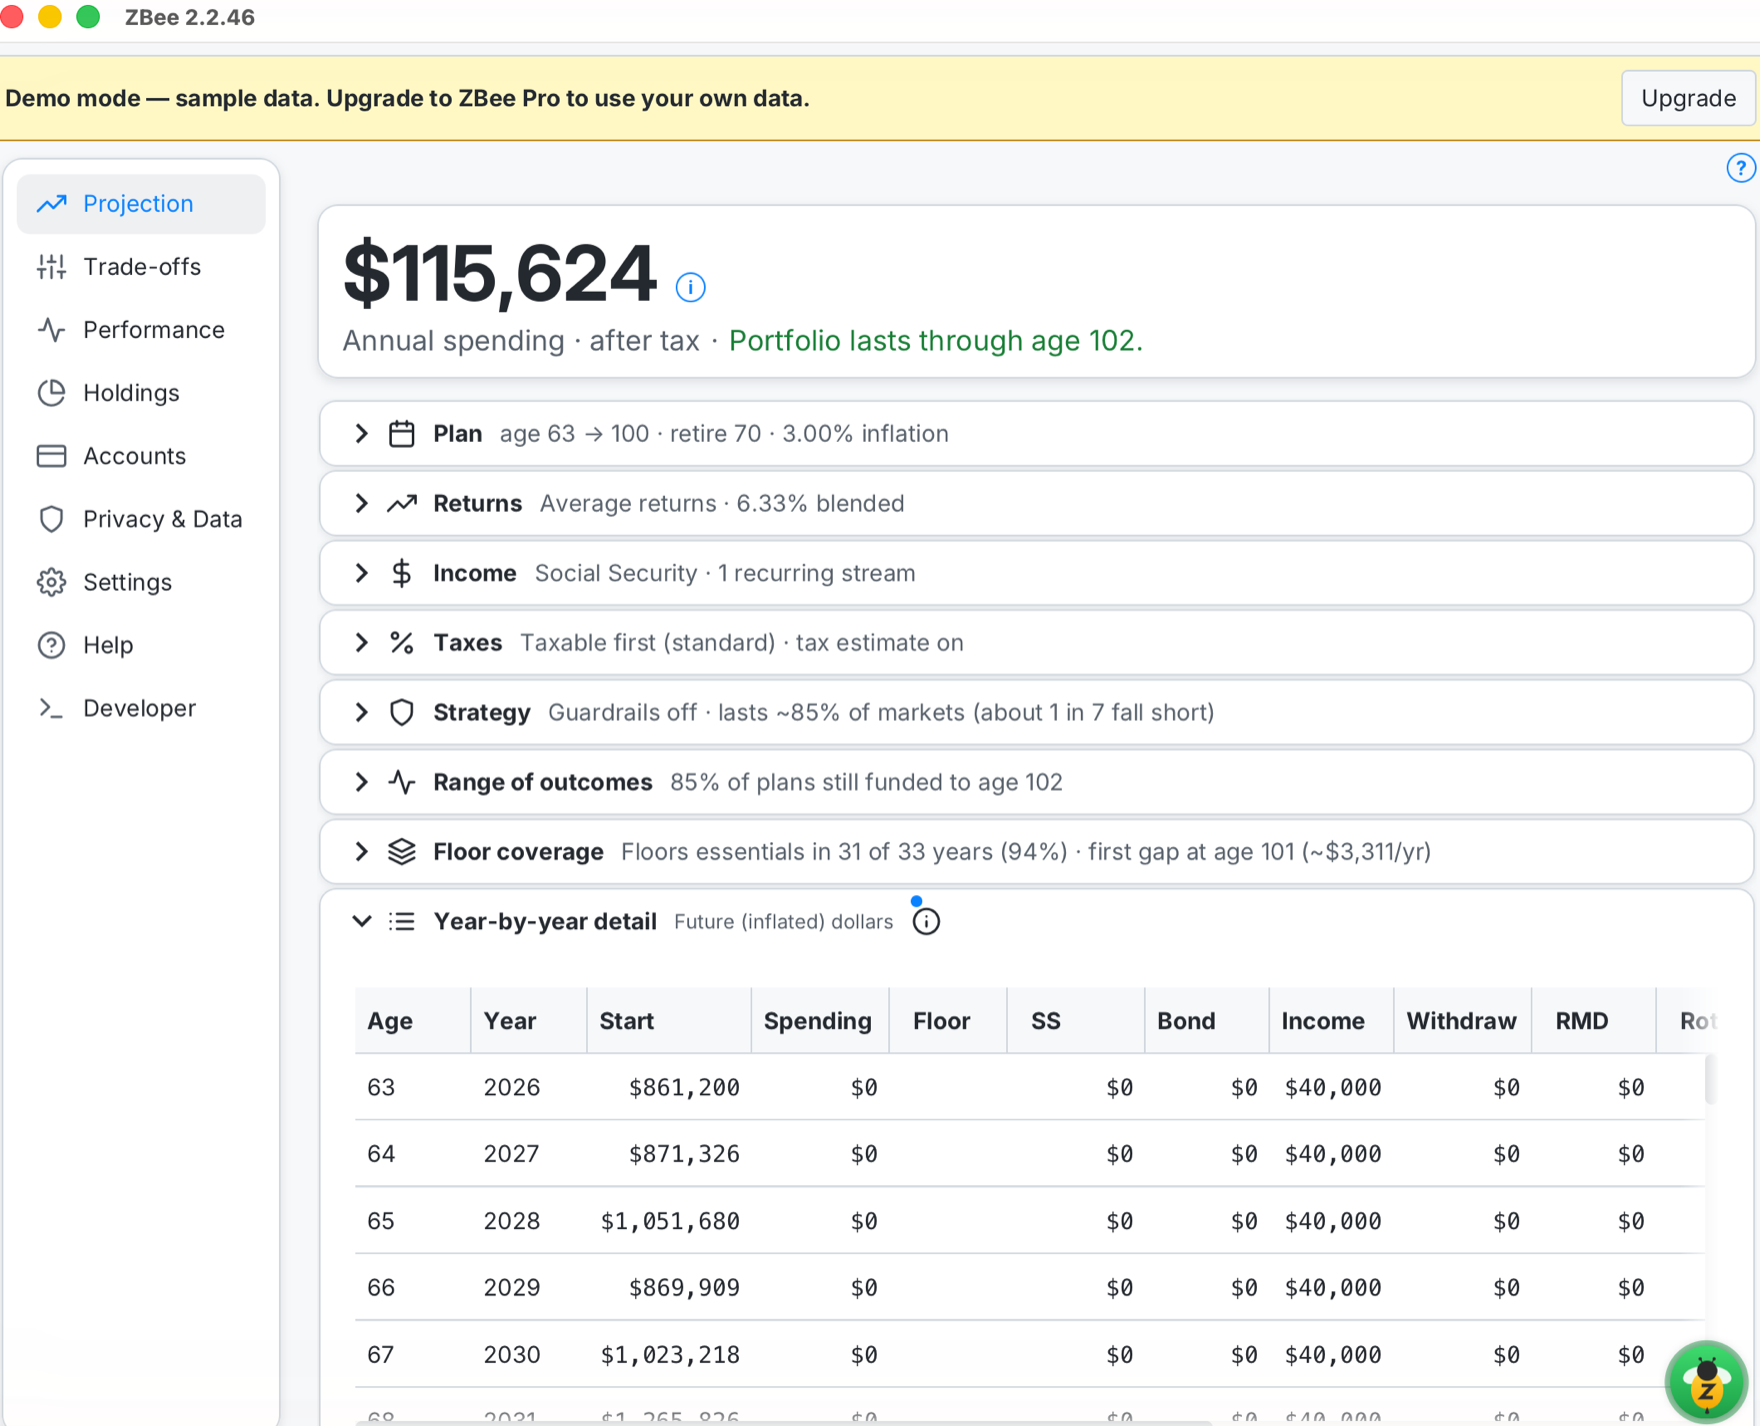
After the calculation lands, nothing more is simulated. The screen keeps both chosen markets. The year table shows whichever one its Market toggle selects. The panes under Results don't follow that toggle: each one shows the market its question needs, and says which in its heading.
What each pane shows:
- Year-by-year table. Every year of the market on its Market toggle, tough by default: balance, withdrawals by tax type, income, tax, required distributions, and so on. Click a year for its full arithmetic.
- Projected balance. Both markets: the tough one as a solid line, ending near your bequest, and the typical one dashed, usually well above it. The shading behind them is the fan band from the calculation. Hover a year for both balances; click it for the arithmetic of the line you're nearer.
- Spending shape. How spending moves year by year in the typical market, which matters when guardrails are on.
- Taxes over the plan and Withdrawals over the plan. Lifetime totals and the yearly pattern in the typical market, the likelier outcome. Set the table's Market toggle to Typical and its rows match these charts year by year.
Three panes don't follow a single market:
- Could I spend…? Type any yearly figure and ZBee runs it through all 1,000 markets under the same plan and the same guardrail rules, then reports the share that last. It is the same test the calculation used to find your number, applied to a figure of your choosing. Typing your own number back in returns your risk setting.
- This year. When guardrails are on and spending has started, this pane compares the guided spending level you anchored against where the portfolio stands now and says whether this year calls for a trim, a hold, or a raise. It reads the stored anchor and the live balances, not the simulated rows.
- Floor coverage. How much of your essential spending guaranteed income covers in each year. Guaranteed income and essential spending don't depend on returns, so it is the same in every market.
One refinement this page leaves out: if your plan steps spending down at a chosen age, the number at the top is the starting level before the step, and the histogram's bins shift to read in the same units. The passes themselves are unchanged.
Why it is built this way
- One set of markets everywhere. Because every pane reads the same 1,000 sequences, the histogram, the shading, the table and the odds can never disagree. The marker on the outcomes chart sits exactly where the number was found.
- A tough market by default. The table opens on the tough market so you can see the plan that produced the number, year by year, and watch it reach the bequest with nothing to spare.
- A typical market beside it. Most retirements will look more like the typical market, with a surplus at the end. The balance chart draws both, and the lifetime totals for spending, tax and withdrawals use the typical one. Showing both keeps the number honest without making it look grimmer than it is.
- No market to choose on Results. Each Results pane shows the market its question needs and names it, so reading the page never depends on knowing which simulated market a toggle is set to.
- Measurement, not advice. ZBee reports what your current holdings and choices support. It does not suggest moving money, changing allocations, or restructuring accounts.
Related: the full methodology (taxes, RMDs, Social Security, market risk, longevity) · spending guardrails, measured against your whole plan · how much can you safely spend in retirement?
The 1,000 simulated markets are possible futures, not forecasts. The shaded band on the balance chart shows where those simulated markets fall, not a probability that the real market will stay inside it. ZBee is a measurement and planning tool, not financial, tax, or legal advice. Projections are hypothetical estimates that will not match actual results. See the Disclaimer and Terms of Use.